Sweet and bitter taste properties are found in most classes of chemical compounds and a close relationship is found in many structural categories.
A single compound can have both sweet and bitter features, and small structural modifications can result in change in the ratio of sweet and bitter taste intensities (Schiffman et al., 1995)
On the other hand, some evidences suggest that sweet and bitter compounds have properties which are rather independent (Cardello, 1981). However, often most of the sweet compounds tend to taste bitter at different concentration e.g., aspartame, glucose, lacitol, malitol (Schiffman et al., 1995).
In order to understand which features, contribute most to the change in the expected class in the BitterSweetForest classifier, we analyzed the relative frequency of each features of the Morgan fingerprint in the respective sweet and bitter class.
We analyzed the important and frequent features in sweet and bitter compounds. The percentage of occurrences of each feature from Morgan fingerprint (2,048 bits) in sweet and bitter compounds was calculated. The relative frequency of important features for a class (e.g., sweet) were calculated taking not only the feature position and occurrence within the sweet class into account but also the relative feature frequency of that particular feature in the bitter class and vice versa. The average relative frequency for each class were calculated, a feature was only considered active for a class, if it's presence in one class is higher than the average relative frequency of that class as well as lower than the average relative frequency of the other class. The top features for each class were calculated using class-specific weighted bits/feature patterns in the fingerprints.
The top 10 most occurring features in respective classes and their relative frequency in each class are shown in (Figures 1, 2). The top 10 features of the sweet compounds tend to be more independent from the bitter compounds (Figure 1). On the other hand, the some of the sweet molecules seems to exhibit similar features when compared to bitter molecules (Figure 2). It is noticeable that the first three features of the bitter class are more dominant in the bitter molecules; remaining seven features are not strongly independent from the sweet class. The relationship between sweetness and bitterness of compounds are not uniformly linear, however it can be said that bitterness of some sweet compounds can increase or decrease in intensity as a function based on the presence of bitter-related features in them. From the prediction of the BitterSweetForest classifier and features assessment, it can be inferred that increases in bitterness of sweet-tasting compounds are bitter specific feature dependent.
It is observed that the indexes containing the frequent features in sweet and bitter compounds are different signifying that the some chemical features are class specific.
This is reported in our previously published study Banerjee P Preissner R (2018).
Statistics
Top 10 feature frequency in sweet compounds
The distribution of top 10 most occuring frequent features in the sweet compounds and their relative occurences in the bitter class.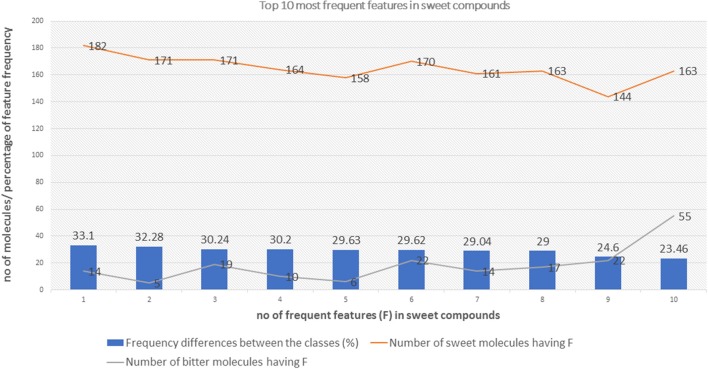
Top 10 feature frequency in bitter compounds
The distribution of top 10 most occuring frequent features in the bitter compounds and their relative occurences in the sweet class.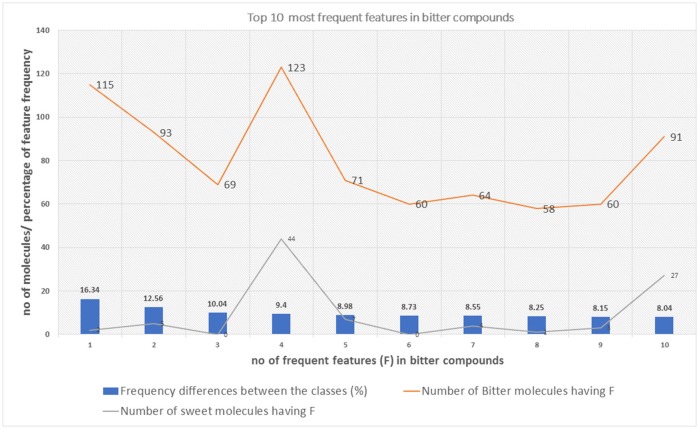
Relative frequency distribution of feature indices
Graphical representation of the relative frequency distribution of each feature index in the sweet class (green) and bitter class (red) for Morgan fingerprints (2,048 bits).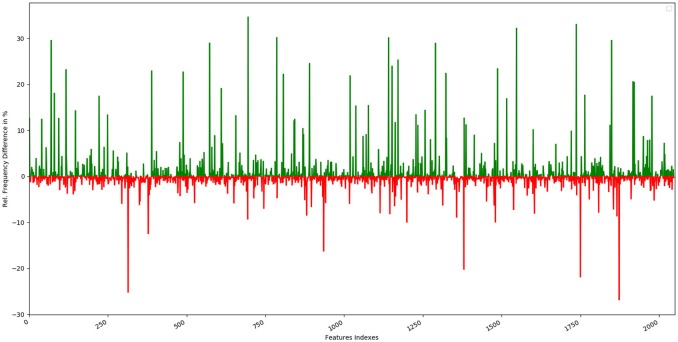
Top 20 features index positions
Top 20 most occurring features and their respective index position in both sweet and bitter molecules. It can be inferred from the figure that the top occurring features between sweet and bitter compounds used in this model are highly independent as individual index position in the fingerprints (bits set to 1) differs.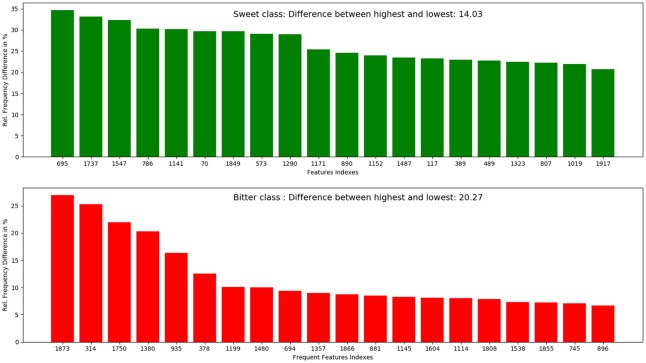
Approved drugs predicted as bitter per ATC class
A total of 1,925 approved small molecule drugs were collected from DrugBank database (Wishart et al., 2017). After standardization and comparing with the dataset set of the model,
almost 1,600 compounds were found to be within the applicability domain. Almost 77% of the total DrugBank (Wishart et al., 2017)
approved dataset could be predicted using the BitterSweetForest classifier, with a confidence score of above 0.75. Out of the compounds
predicted above the threshold of confidence score of 0.75, 98% of the drugs were predicted as bitter and 2% as sweet.
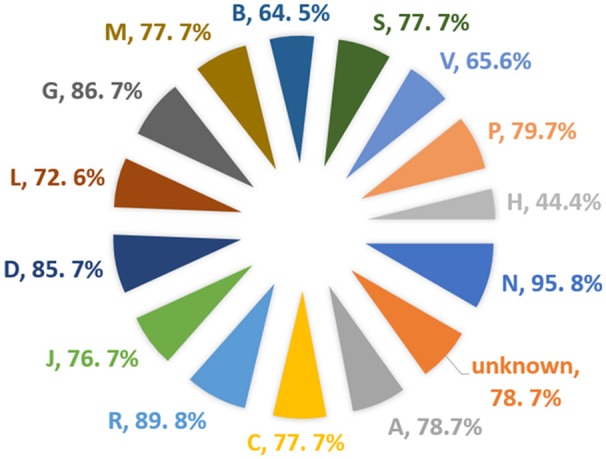
This is interesting as bitterness is often connected to drugs when administrated orally. We further analyzed the Anatomical Therapeutic Chemical
(ATC) (Nickel et al., 2014) classification of drugs (Figure 5); it was that 95% of the total drugs under the classification of Nervous System (N)
were found to be bitter, not a single drug from this class was predicted as sweet above the threshold of 0.75. The second highest predicted class
of drugs is Respiratory system (R) with a total of 89% of the drugs predicted as bitter. The third predicted class of drug is Genito urinary system
and sex hormones (G) with 86.7% predicted as bitter. There was no ATC classification available for almost 231 drugs predicted as bitter.
On the other hand, only 4.1% of the total drugs from ATC class various (V) were predicted as sweet with a confidence score of above 0.75.
The DrugBank ID as well as the predicted taste class along with confidence scores for the prediction is provided in the Drug Taste section.
This analysis was done in our previous study Banerjee P Preissner R (2018) BitterSweetForest: A Random Forest Based Binary Classifier to Predict Bitterness and Sweetness of Chemical Compounds.